
Ezra Klein and Susannah Locke of Vox have compiled a series of maps that explain food in America, a few of which we’ve provided here below. In a nation with both food insecurity as well as an obesity crisis, it’s good to have a clear idea of where our food comes from and how we eat it.
1
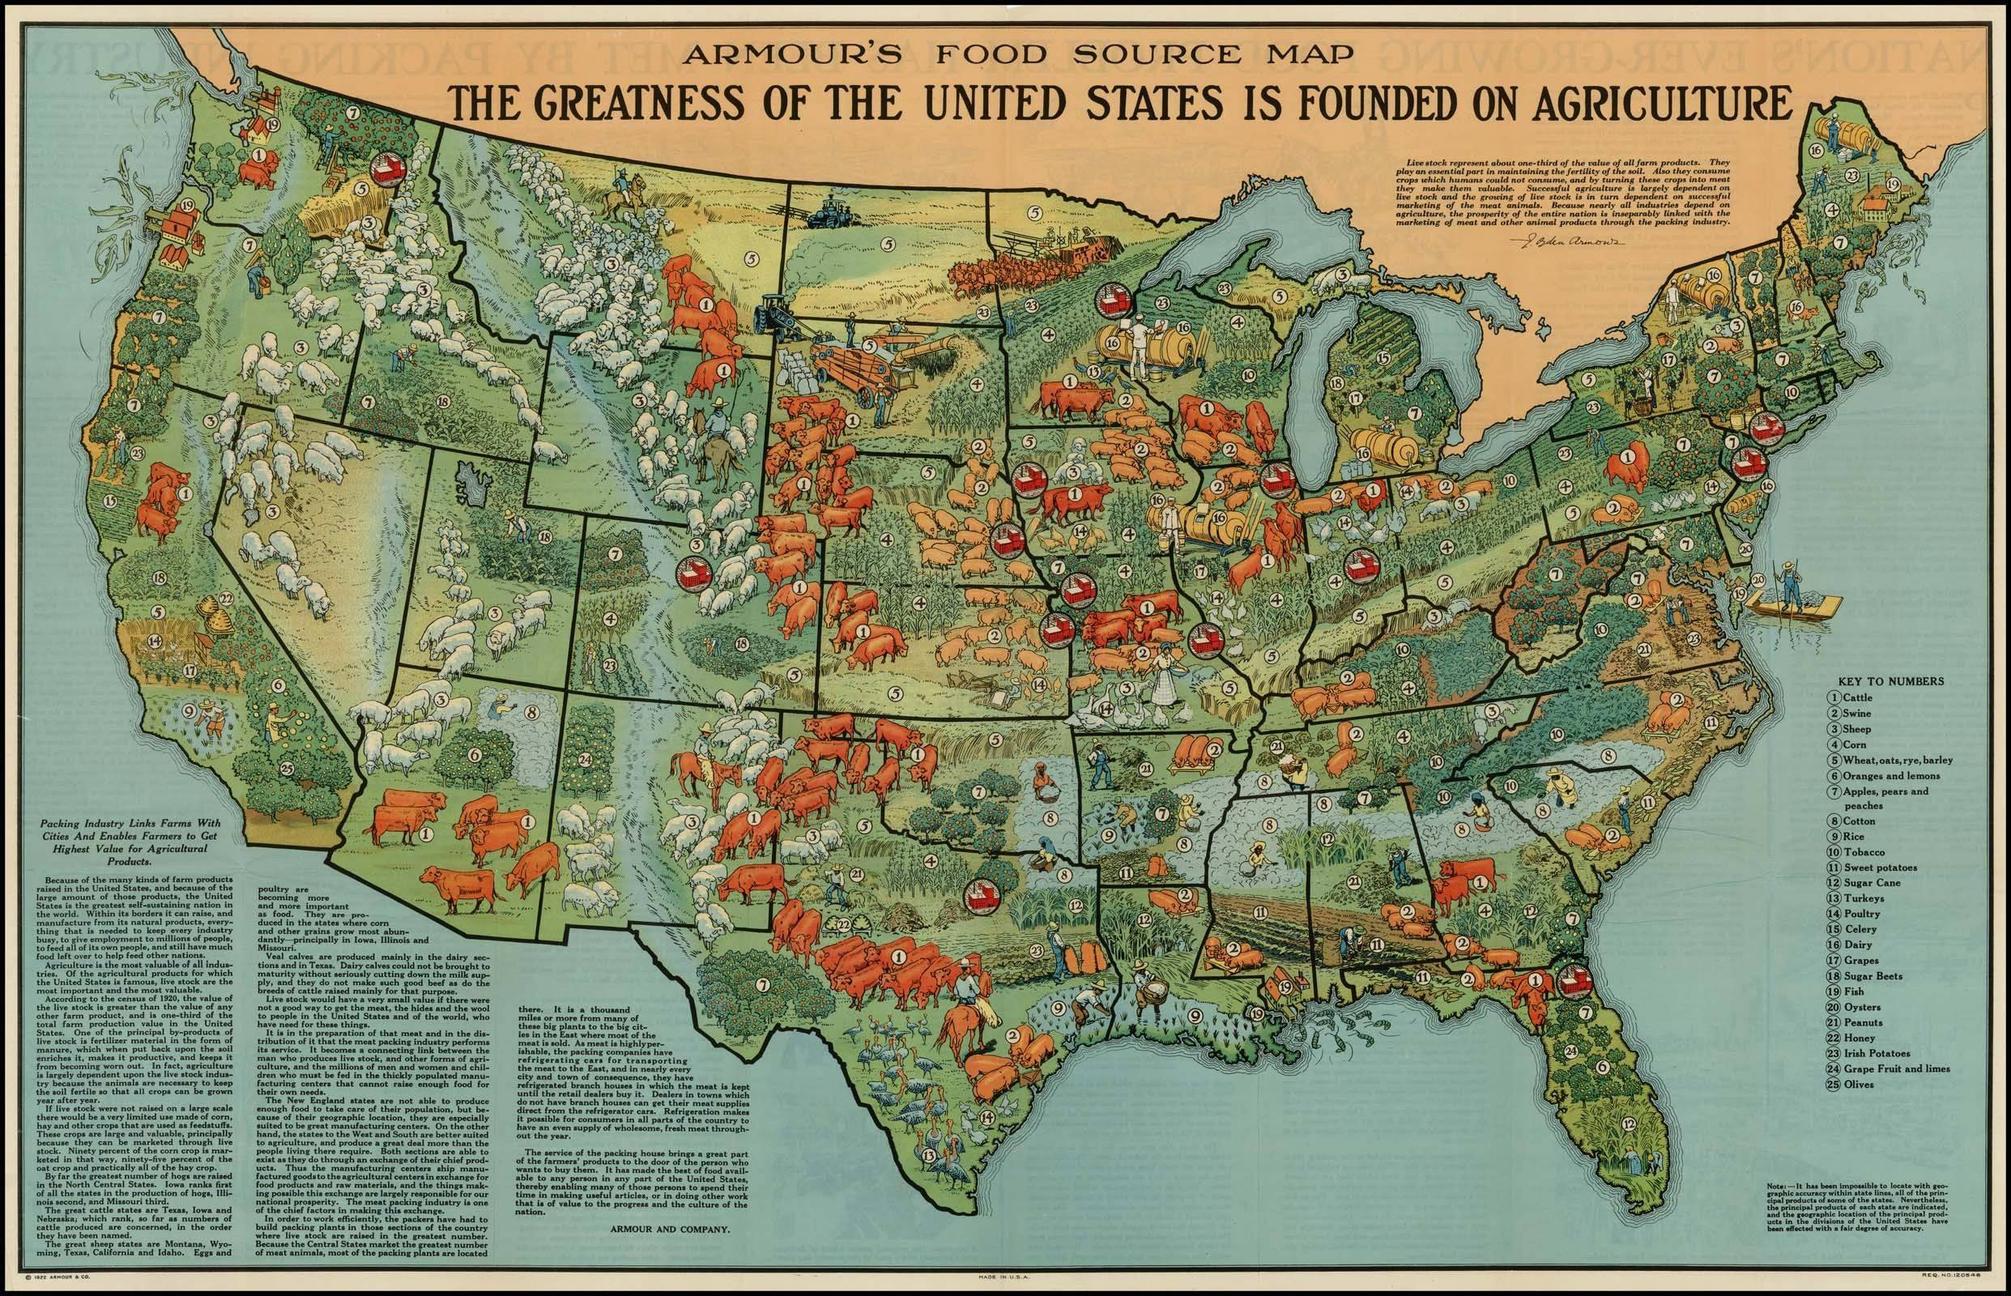
American Agriculture in 1922
Klein and Locke begin their report by sharing a map found by Redditor Sverdrupian, which was published in 1922 by the Armour and Company meatpacking firm. The map “purports to show the principal agricultural products across the country at that time.” However, as pointed out, the broad message of the map is that America’s strength at that time was derived from its strength in agriculture.
2
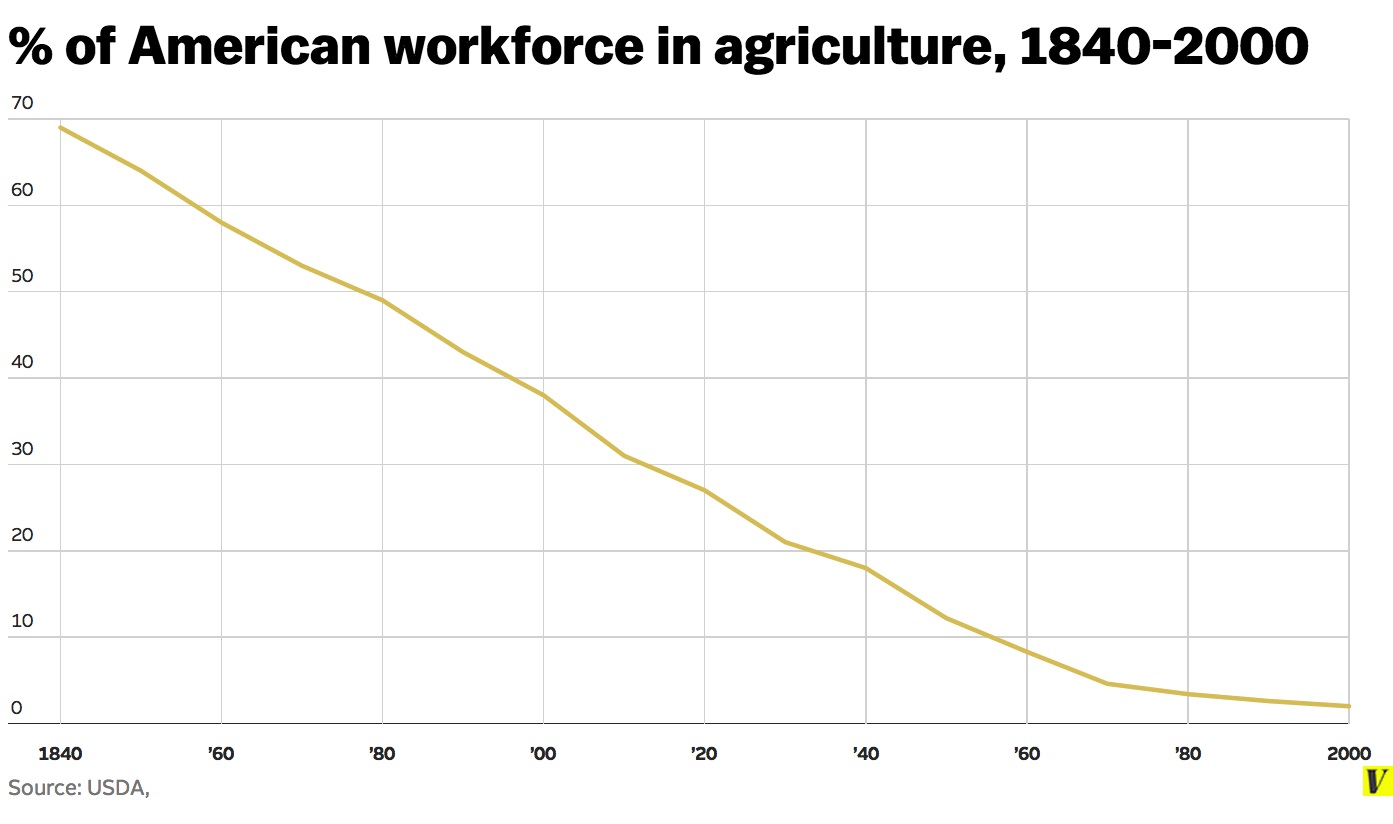
A History of American Workforce in Agriculture
In this particular case, those at Vox have provided a chart from the USDA rather than a map, however the information provided it relevant to the information given in this report. The chart shows that in 1840, almost 70 percent of Americans worked in agriculture whereas by 2000, it was barely 2 percent.
3
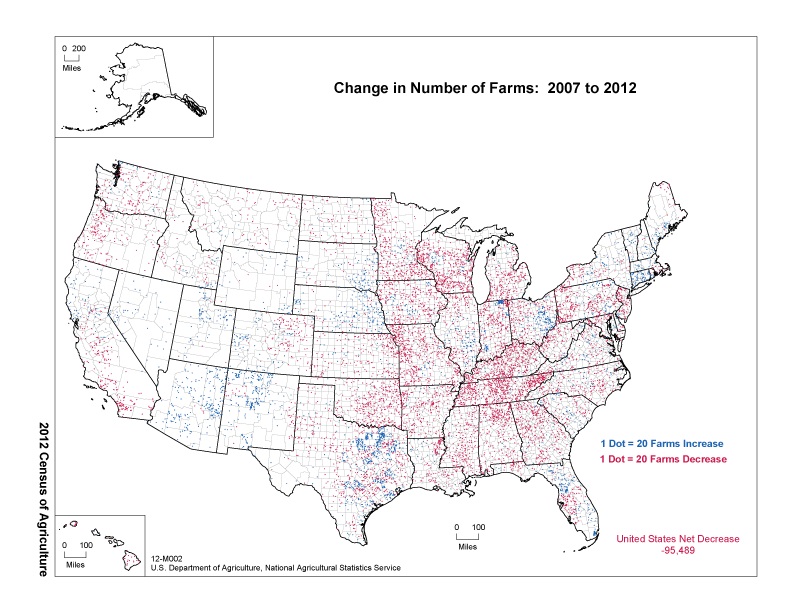
The Loss of Farms
The following map shows the loss of farms in America to coincide with the loss of farmers. “Note the losses in Kentucky and Tennessee and the gains in Arizona, New Mexico, and Texas. In just five years, the US experienced a net loss of 90,000 farms.”
4
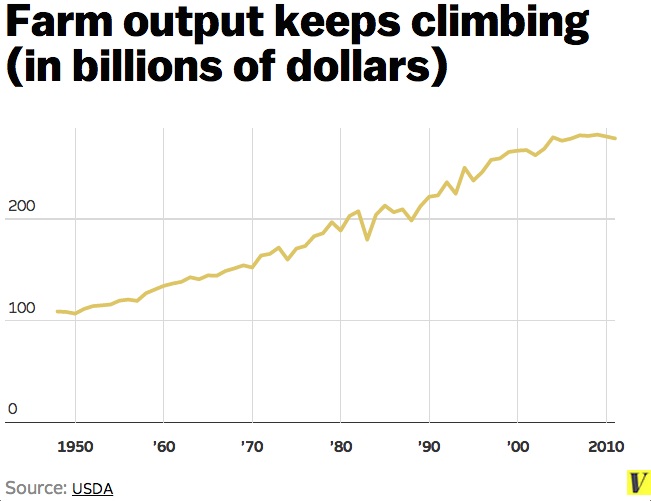
And yet, Farm Output is climbing
This chart shows that while agriculture workers and farms have declined, productivity has increased. This is due large in part to technology, however the use of pesticides, and ultimately GMO’s, have contributed to this as well. As a result, many GMO supporters love to use productivity as an argument to embrace the use of genetically modified organisms, but of course we’re finding that shortcuts, as usual, come with consequences.
5
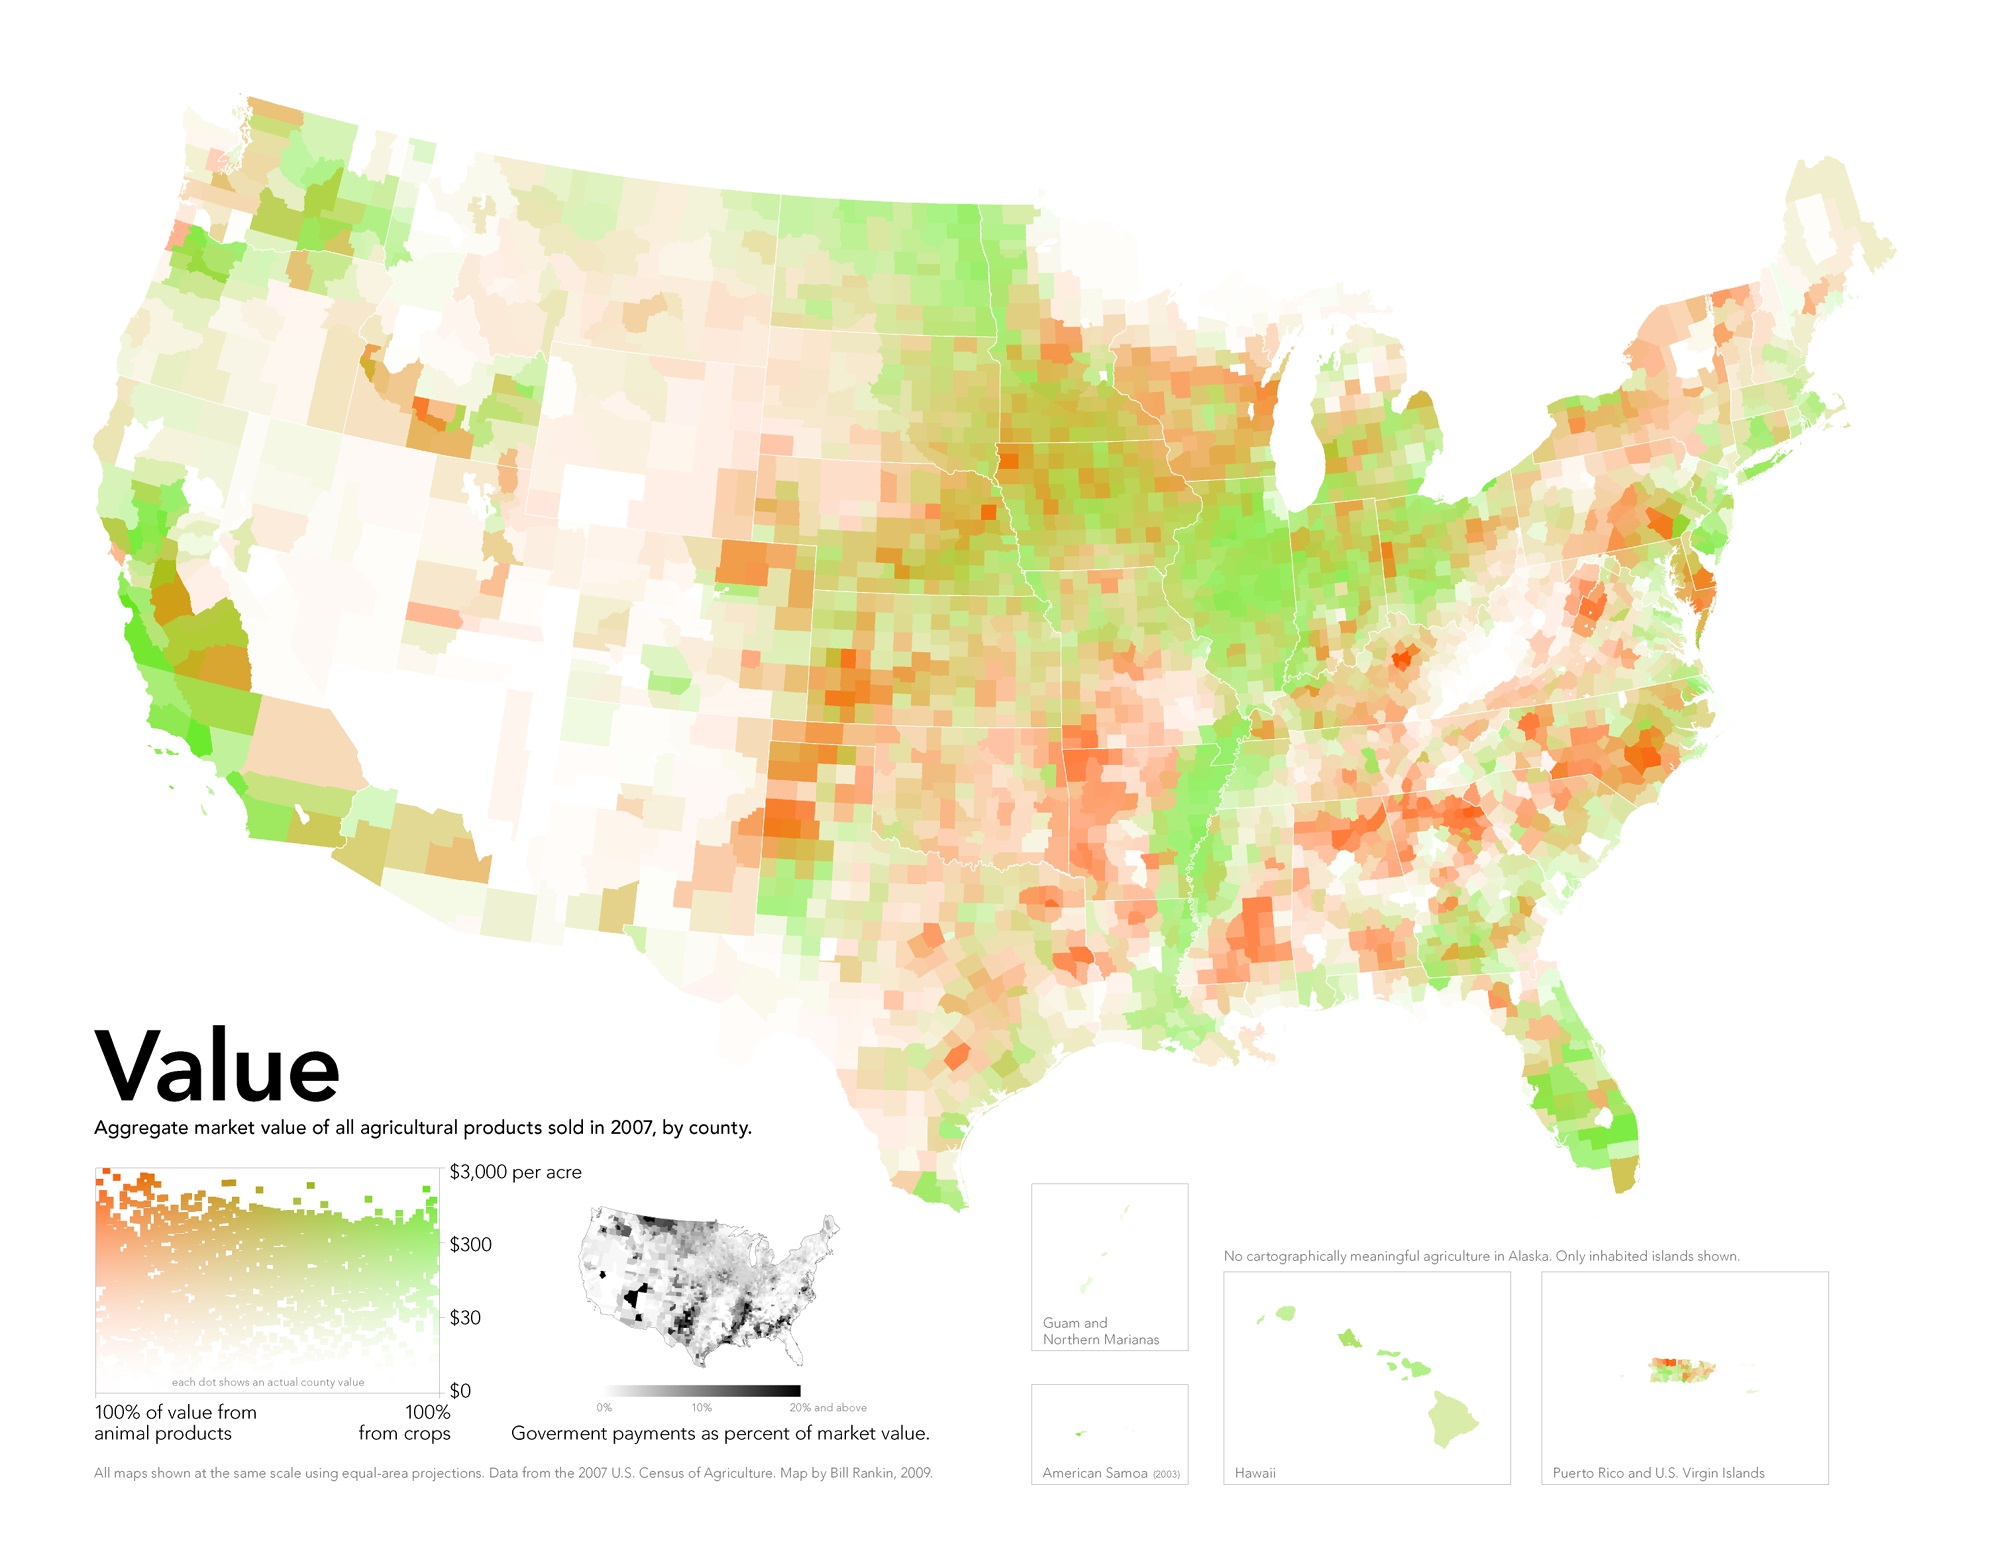
The Value of Crops, and the Value of Livestock
The following map was created by cartographer, Bill Rankin, using USDA data. The red indicates livestock, while the green indicates crops.
6
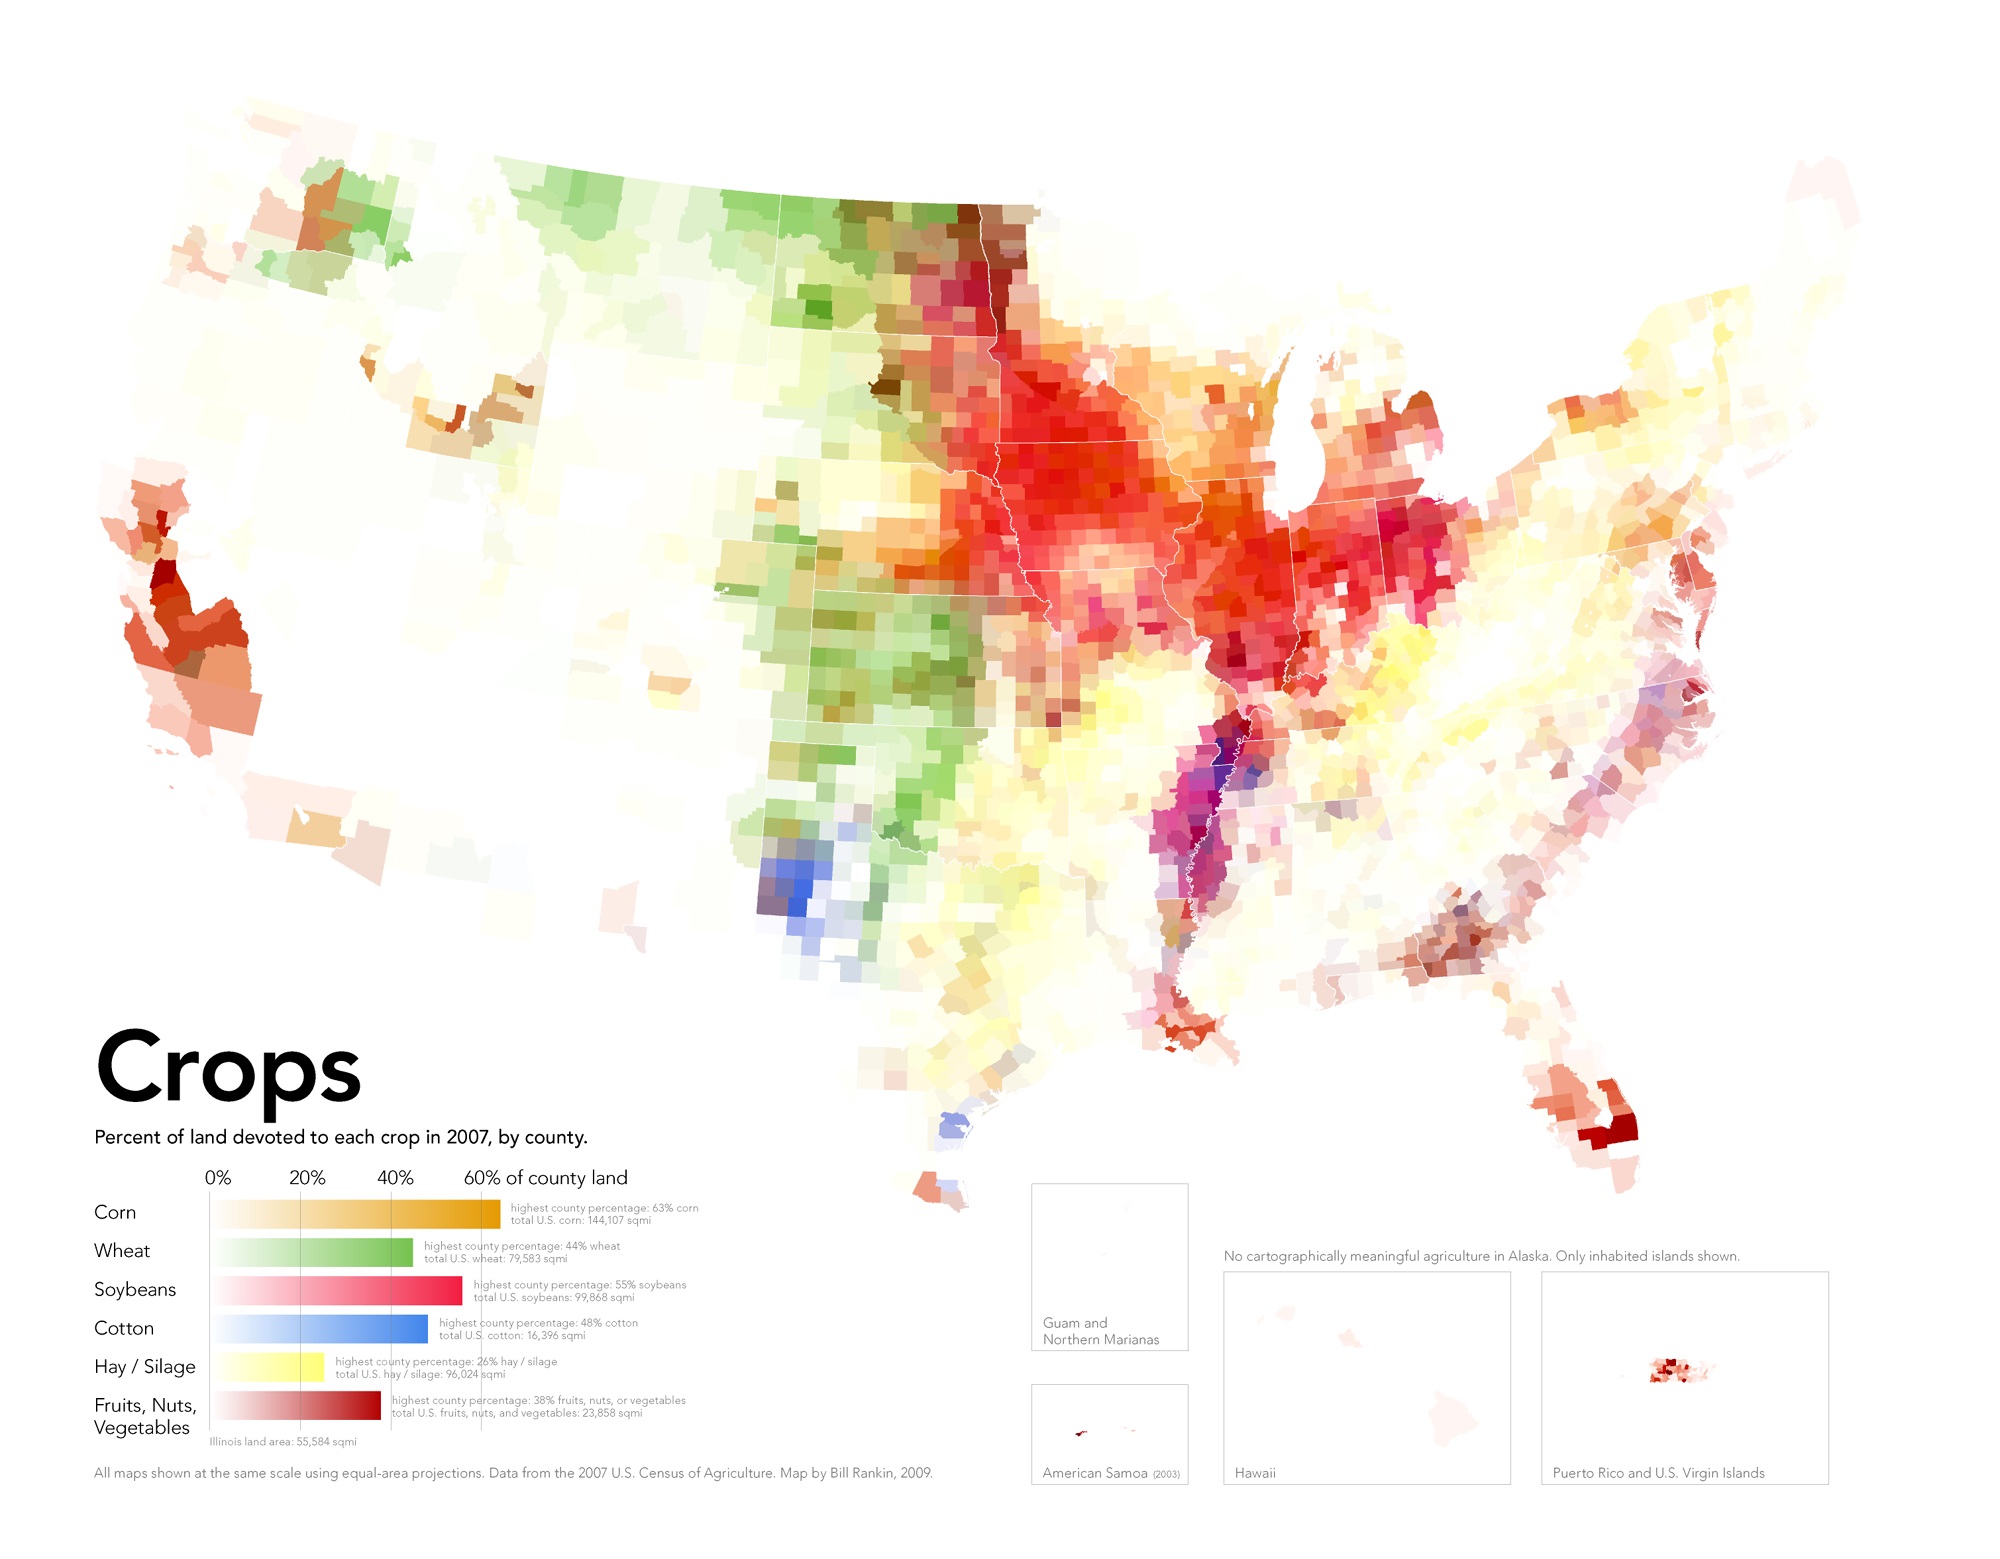
Where Crops are harvested
Crop output is shown in this map, with an emphasis on where particular crops are being grown across the country. The point made with this map is that Monoculture—the practice of focusing almost exclusively on one crop—is clearly evident. Corn covers more land than any other crop in the U.S.
7
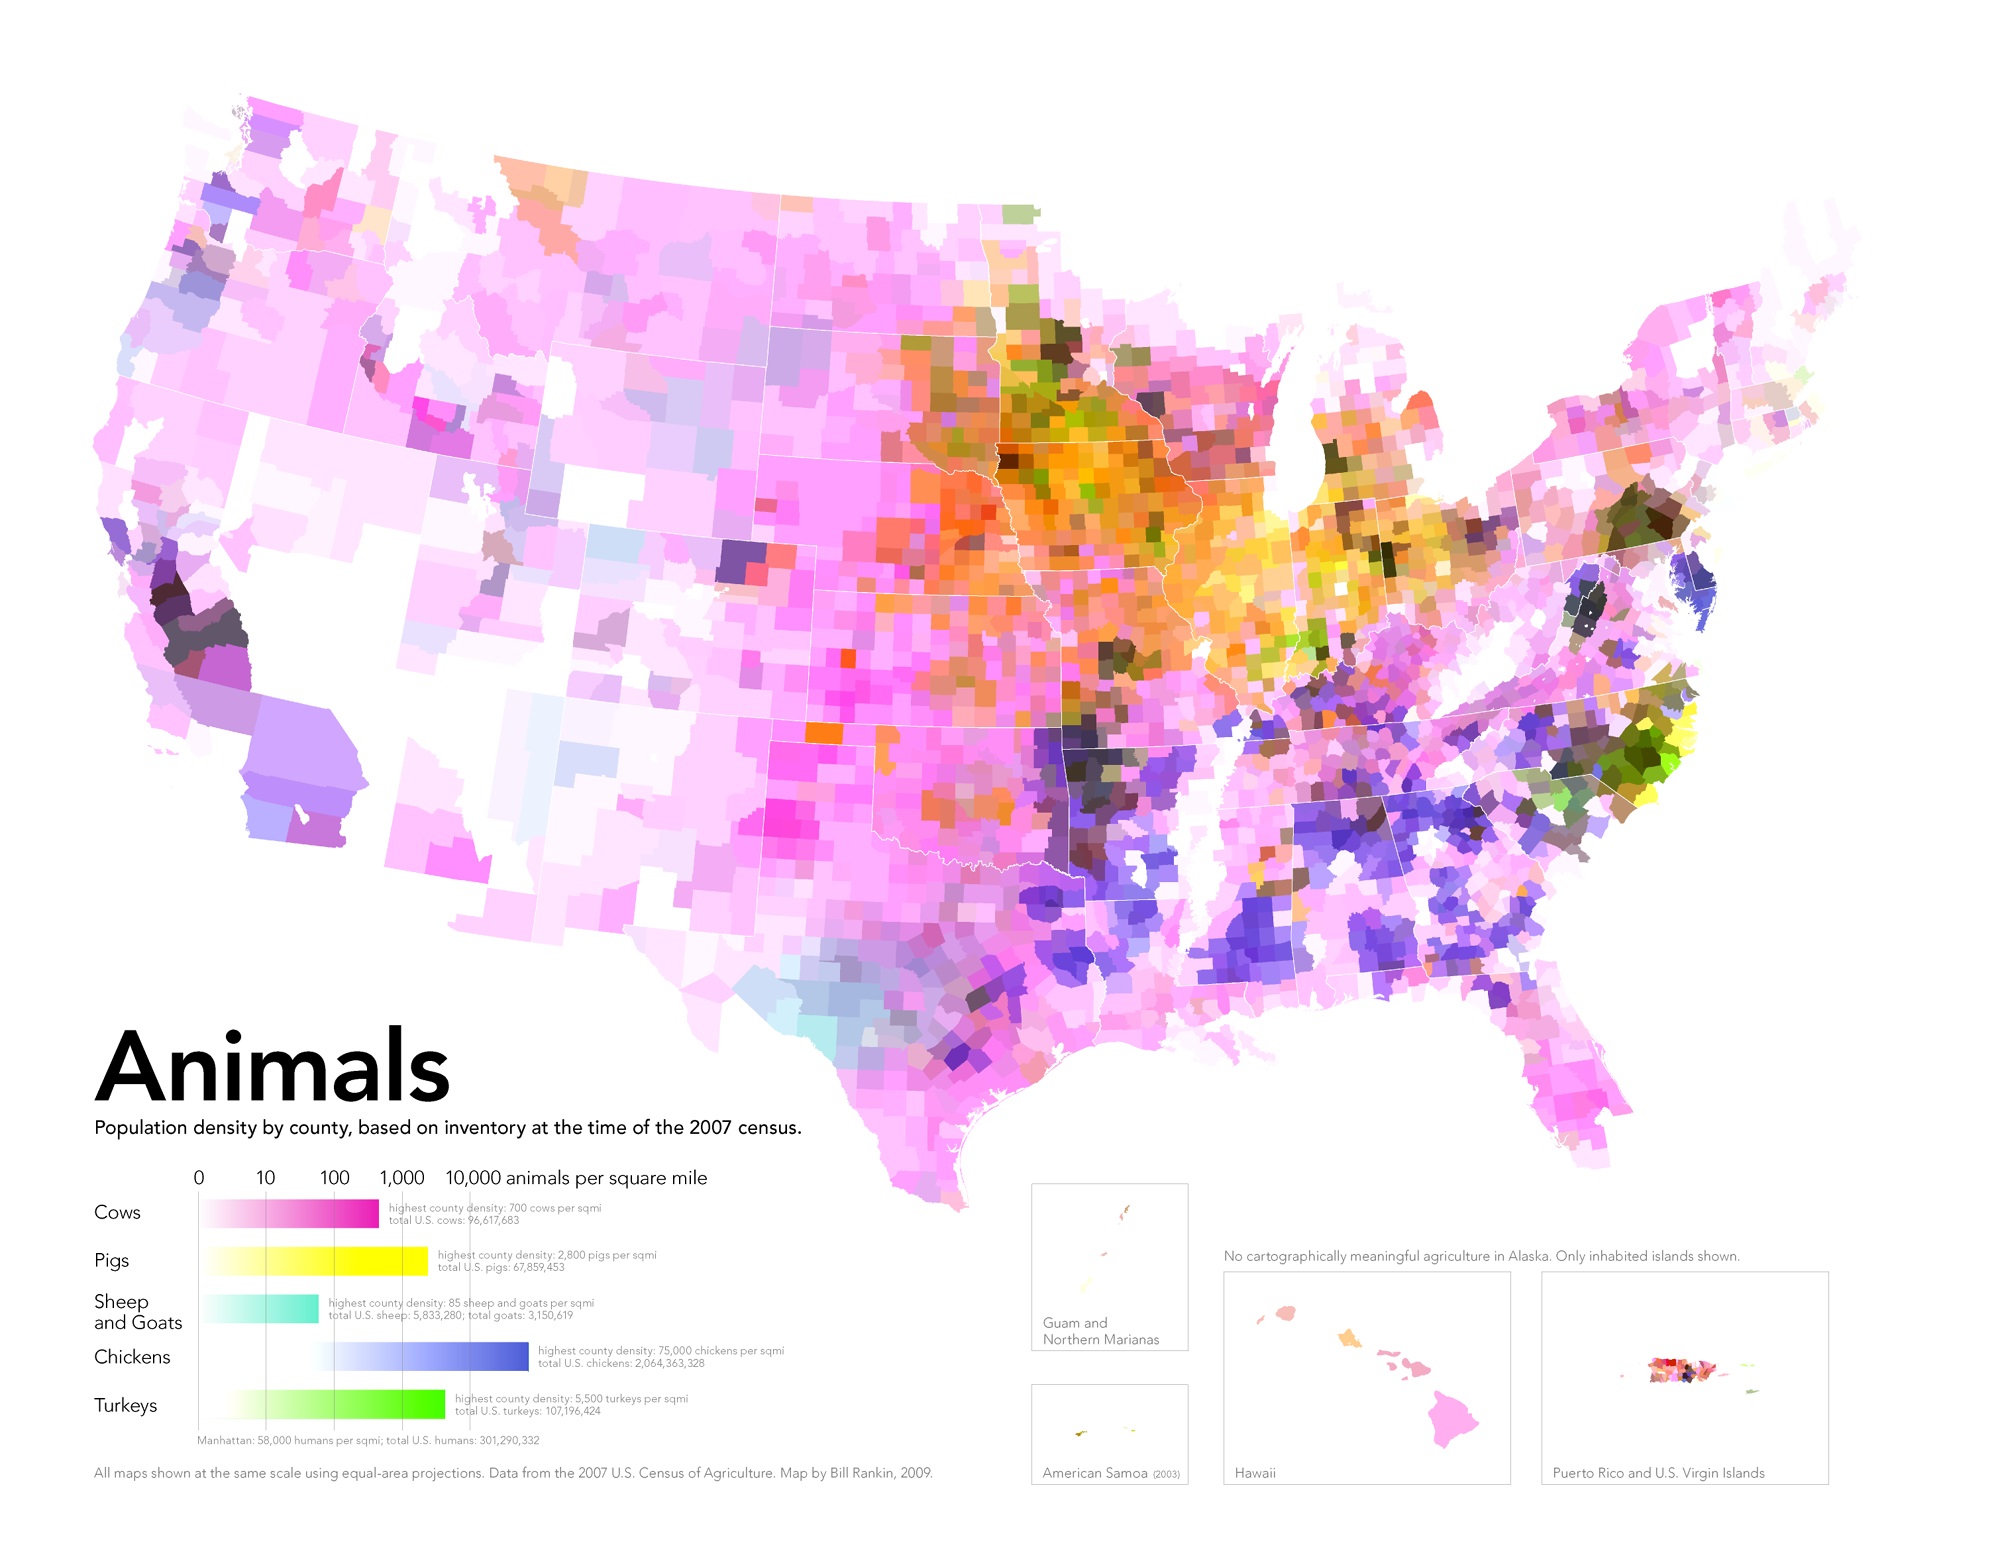
America’s Cow Population
For as expensive as beef is here in the States, cows are almost everywhere. Pigs and chickens can be clearly seen as well, with sheep, goats, and turkeys falling behind, however America’s cow population has dominated this particular map, making it the main focus.
8
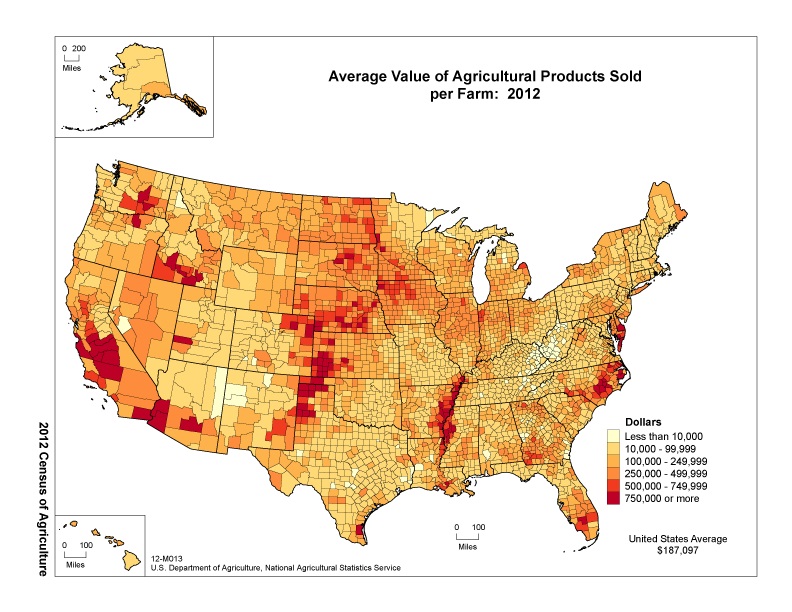
Average Sales by Farm
It’s clear from this map that the average income of farms varies greatly, with some farmers selling less than $10,000 in goods a year, and others earning as much as $750,000 a year. Of those farms that earn the most, their types vary as well, with the area along the Mississippi making excellent profits in soy and cotton, and both Texas and North Carolina making high profits off cattle and various other livestock.
9
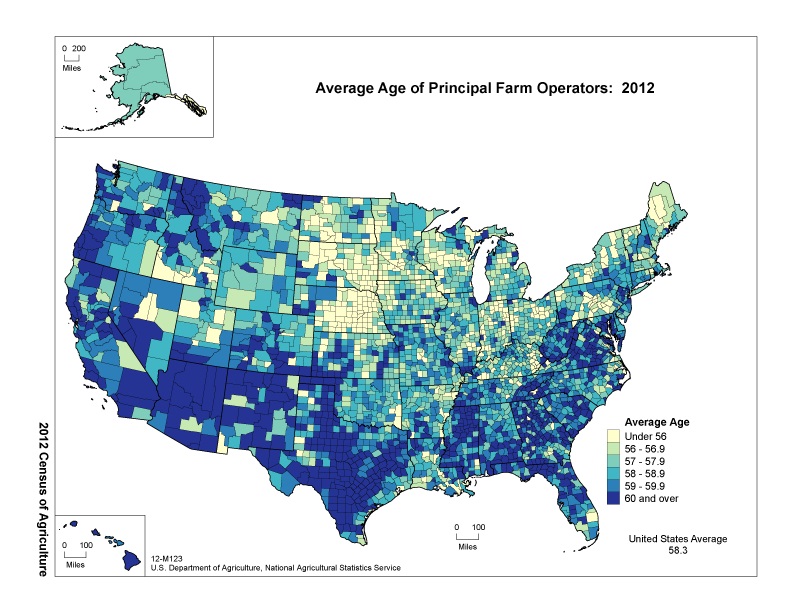
The Average Age of Farmers
It would appear farmers are getting older, with the average age of a principal farm operator being 58-years-old, and according to the USDA, they are only getting older. By 2012, around one third of farmers were older than 65, however the majority of farms in America are small, with about 75 percent making less than $50,000 a year, according to Vox.
10
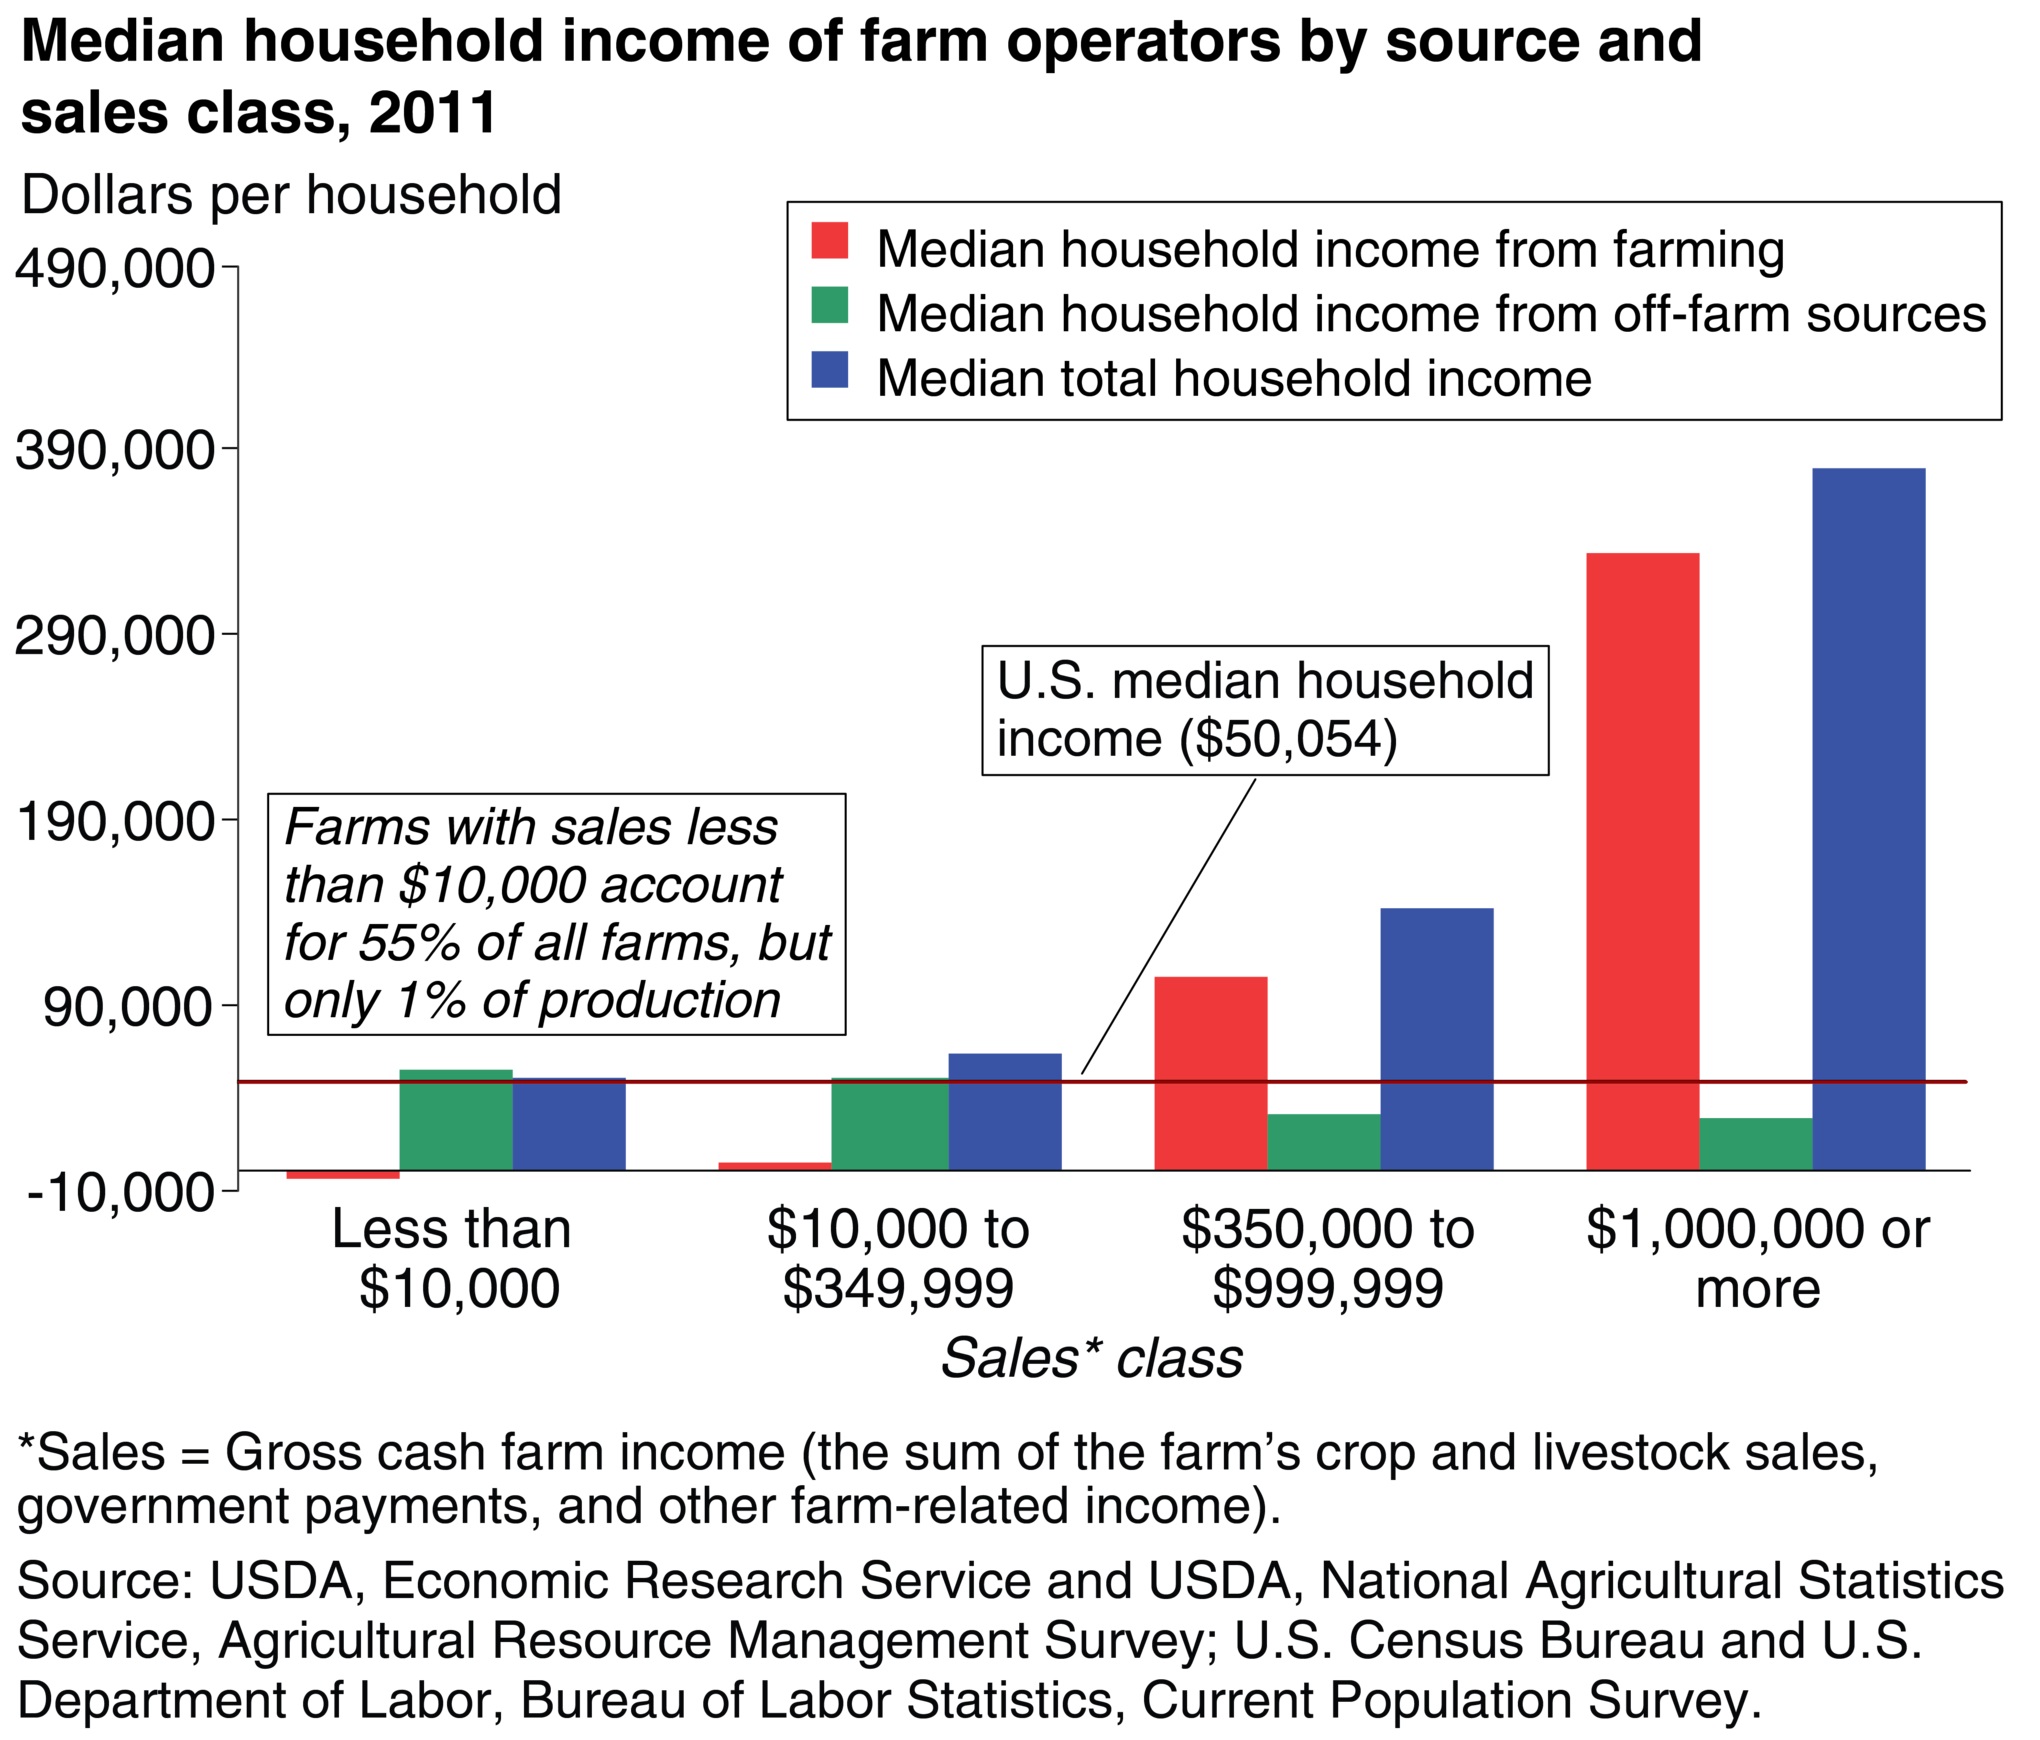
The Median Household Income of a Farmer
Unfortunately, many farmers aren’t making enough to get by. As mentioned before, most farms are small, and as a result the average median income of a lot of farmers only helps to provide a little extra income on top of whatever jobs they have. According to the USDA, about 4 percent of U.S. farms produce 66 percent of all farm products by value.
Vox’s report provides numerous other interesting maps, for the health-conscious Anons out there, that pertain to America’s food supplies, from crop cash receipts (in $ billions) to the rise of the bottled water consumption. With Americans becoming more aware of the over-processed, sugar-saturated, chemical-induced foods they are eating on a daily basis, the maps portrayed give valuable insight into America’s food production and consumption.
This Article (Here’s a Series of Maps that Explain Food in America) is a free and open source. You have permission to republish this article under a Creative Commons license with attribution to the author and AnonHQ.com.
Sources:
Klein, Ezra and Locke, Susannah. Vox. Jun 9, 2014. (http://www.vox.com/a/explain-food-america?utm_medium=social&utm_source=facebook&utm_campaign=voxdotcom&utm_content=sunday)


